In the Kubernetes world, Prometheus and Grafana are de-facto standards for monitoring.
TAP is a truly amazing platform, but one of the main areas it currently lacks, is a good monitoring story. While some of the components used within TAP have metrics endpoints, many of them don’t, and even those that do, correlating between one another is not a simple task.
Recently when working on some upstream work regarding ClusterAPI i became aware of a great new feature in the commonly used Prometheus exporter called Kube State Metrics (KSM).
KSM is typically used to pull data from the status fields and specs of common kubernetes resources, and to convert them into metrics which can be scraped by prometheus.
KSM now includes the ability to define a config file with the desired mapping of resource fields to metric labels and values for any Custom Resources, and it will be able to provide us metrics for them as well!
With this in mind, I decided to perform a small POC of building out a monitoring suite for TAP, using KSM.
For this setup i decided to use the kube-prometheus-stack helm chart which makes deploying a fully functional Prometheus and Grafana stack as easy as it gets, and then extend the configuration to support the TAP CRDs, and generate the needed metrics.
For this initial POC i decided to focus on a subset of the TAP resources.
The resource types and corresponding prometheus metrics being monitored are:
- workloads – cartographer_workload_info , cartographer_workload_status
- deliverables – cartographer_deliverable_info , cartographer_deliverable_status
- service bindings – service_binding_info, service_binding_status
- cluster instance classes – stk_cluster_instance_class_composition_selector, stk_cluster_instance_class_status
- class claims – stk_class_claim_info , stk_class_claim_status
- resource claims – stk_resource_claim_info, stk_resource_claim_status
- knative services – knative_service_info, knative_service_status
- knative revisions – knative_revision_info, knative_revision_status
- kapp controller package repositories – carvel_packagerepository_info
- kapp controller package installations – carvel_packageinstall_info
- kapp controller apps – carvel_app_info, carvel_app_namespaces
- api descriptors – api_descriptor_info, api_descriptor_status
- tekton pipeline runs – tekton_pipeline_run_info, tekton_pipeline_run_status
- tekton task runs – tekton_task_run_info, tekton_task_run_status
- accelerators – accelerator_info, accelerator_imports_info, accelerator_status
- fragments – accelerator_fragment_info, accelerator_fragment_status
- flux git repositories – flux_git_repository_info, flux_git_repository_status
- image scans – scst_image_scan_info, scst_image_scan_status
- source scans – scst_source_scan_info, scst_source_scan_status
- kpack images – kpack_image_info, kpack_image_status
- kpack builds – kpack_build_info, kpack_build_involved_buildpacks, kpack_build_status
With these resources and metrics defined I was able to create a simple yet very powerful dashboard in Grafana for visualizing the state of my TAP environment.
First we can show the status of out package installations

We can then show the status of our workloads and some data about them, including which workloads are utilizing the live update and remote debugging features which is a great piece of data to see how your developers are utilizing the platform!


We can then show details about our Flux Source Controller resources


And then we can deep dive into TBS metrics including things like how many workloads are using different buildpacks!

We can also show image scanning results and statistics

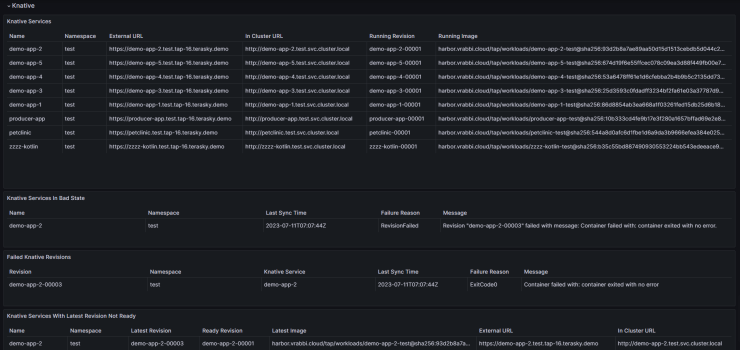
We can also show details about Knative configurations as well
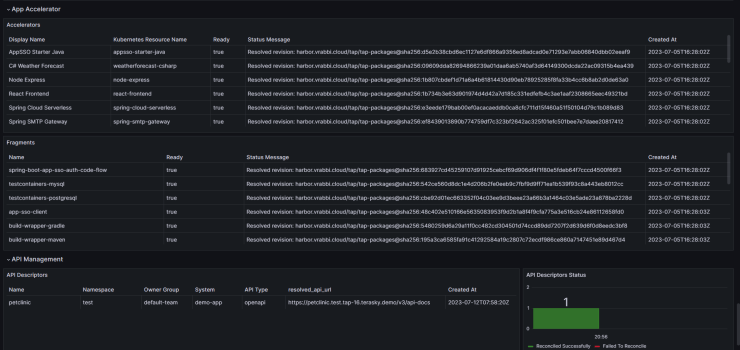
We then can look into application accelerators and their status in our TAP environment, as well as API descriptors which are registered with TAP GUI
CD is also important so we can also see the details and metrics about our deliverables

And finally we can dig into the service bindings and Services Toolkit resources providing backing services to our workloads!


As you can tell, with just this YAMl configuration, and without a single line of code, the options are endless!!
While this is currently in a POC state, I believe it shows a true potential and already provides value when operating a TAP environment.
For those interested in how to get this running in your environment, you can take a look at my Github repository with the Kube State Metrics configuration. While the dashboard is not available today, it should be easy for anyone to build based off of the metrics they care about.